Homelab Dashboard
Quick update on my personal homelab server.
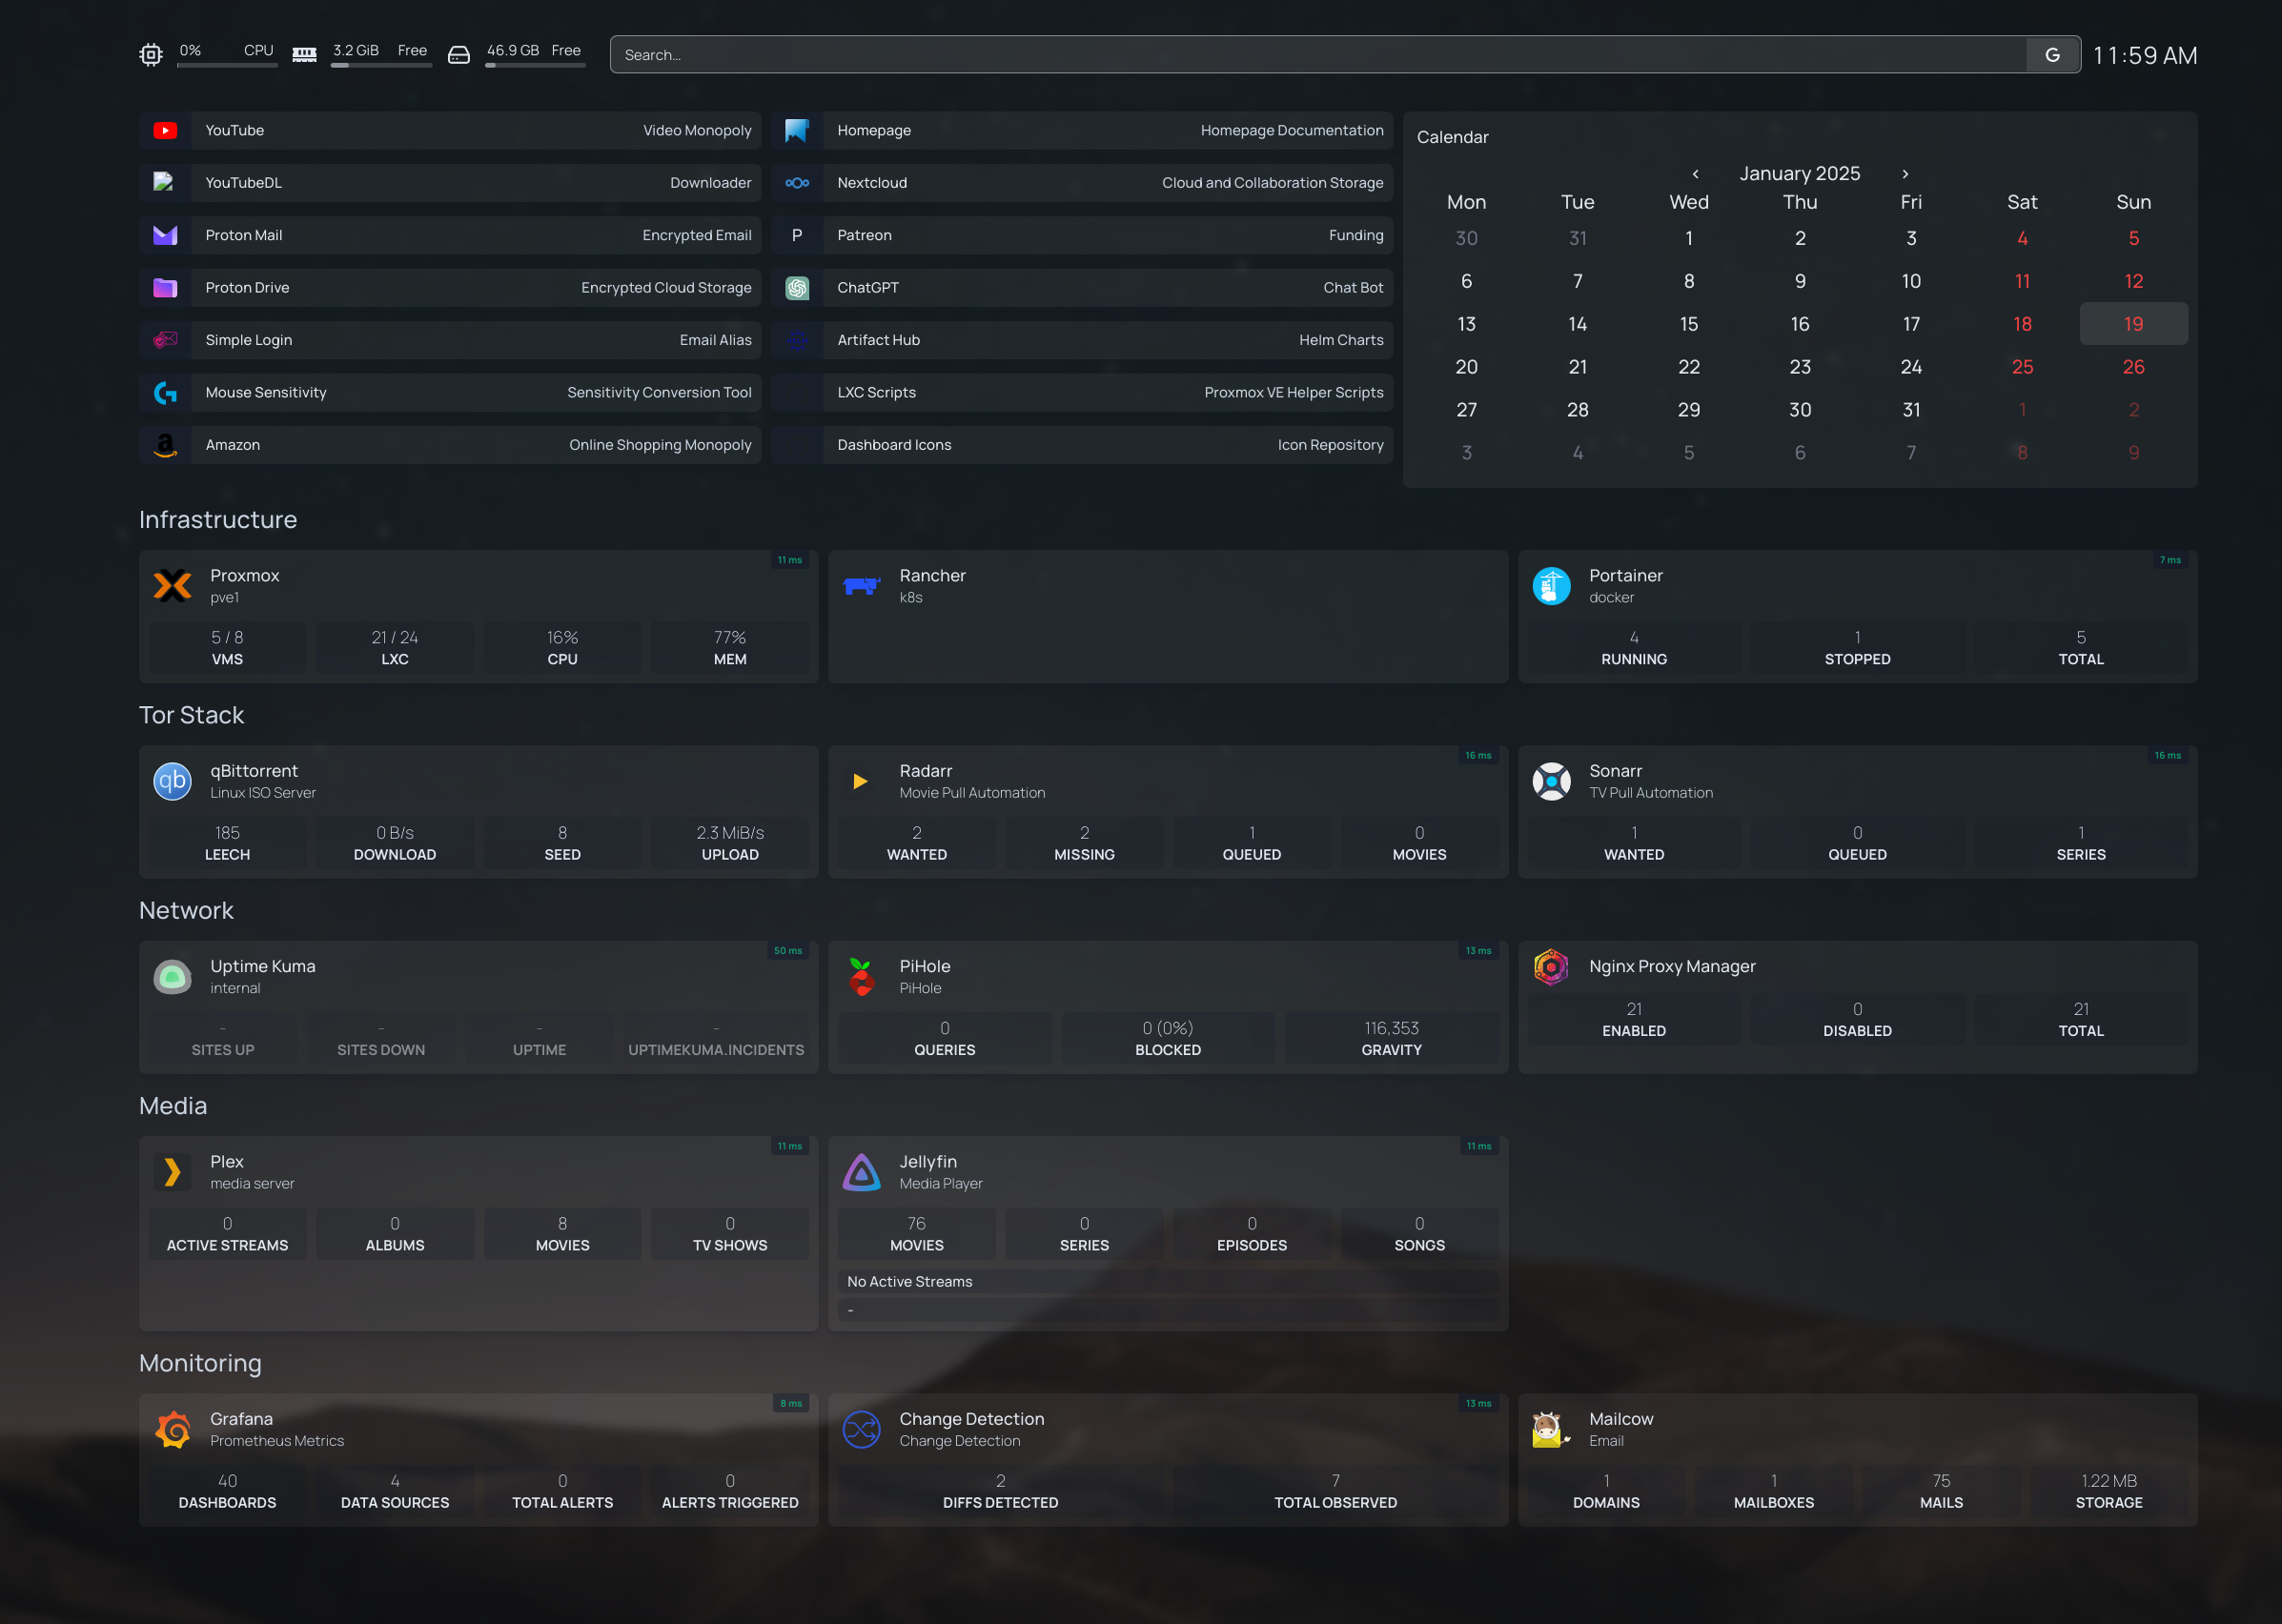
I set up a dashboard using homepage to monitor and manage all my services in one place. Though it was a bit tedious to set up, it turned out well.
I also setup a Debian VM on my proxmox to host some of the applications on docker.
The applications I am hosting through docker are:
- FreshRSS - RSS Aggregator
- Memos - Self-hosted note-taking application for capturing and organizing thoughts
- Wallos - Open Source tool for tracking and managing personal subscriptions
- Mailcow - Full-featured email server solution with SMTP capabilities
Setting up Mailcow has been rewarding. As now, I am able to deliver some of the notifications from my applications directly to email.
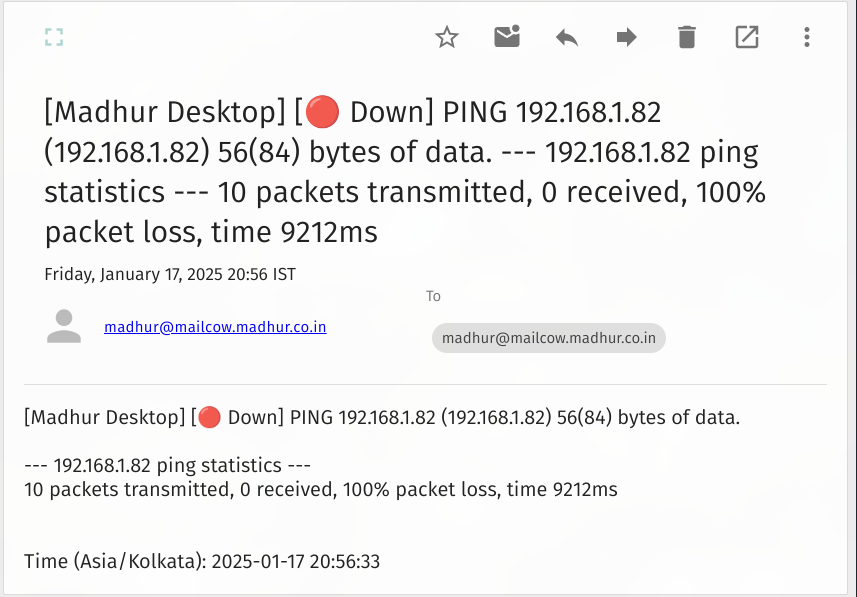
Example of some of the notifications are:
Torrent download complete notification through qbittorrent.
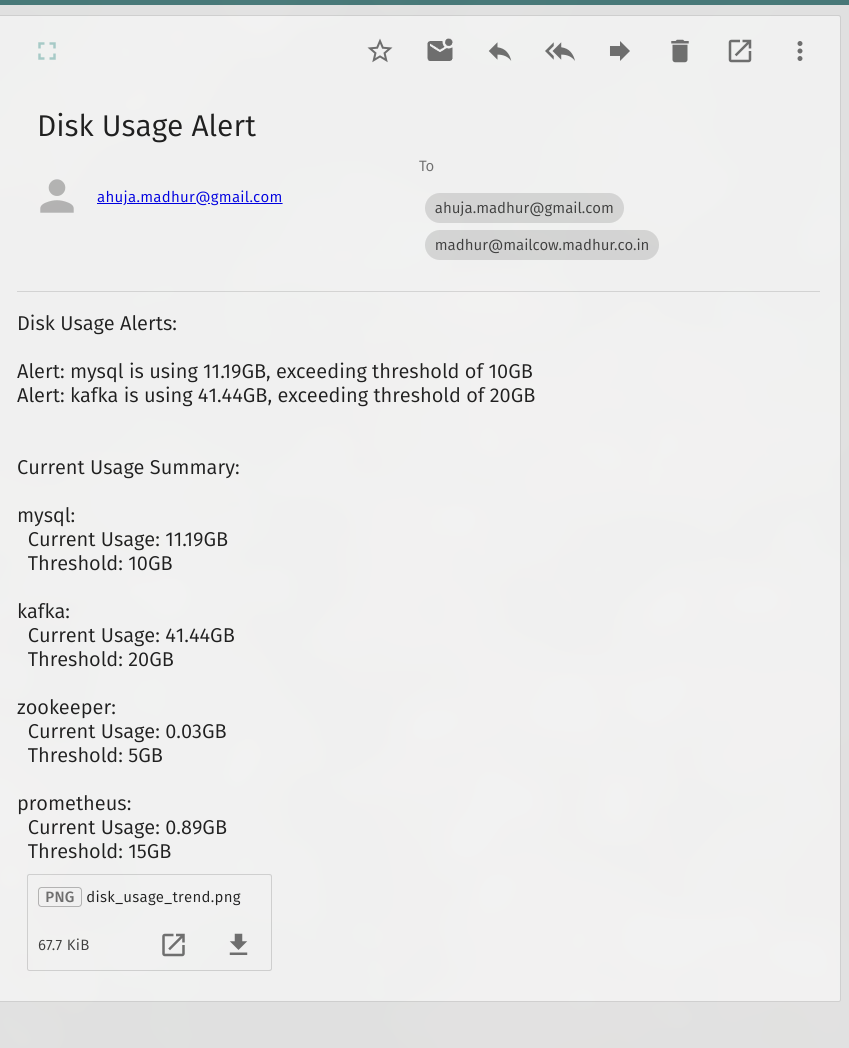
Disk usage of some of my applications
Find the disk monitoring script here
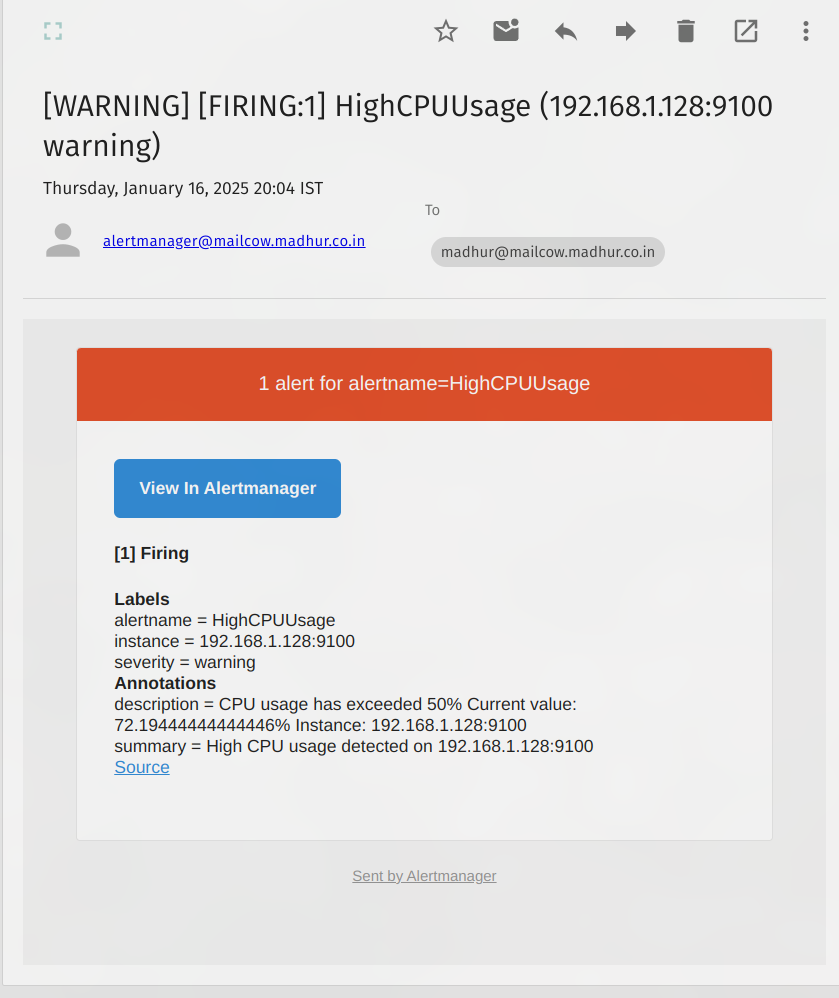
CPU Utilizations of my servers in homelab through AlertManager
Prometheus configuraiton for same
groups:
  - name: cpu_alerts
    rules:
    - alert: HighCPUUsage
      expr: |
        (1 - avg by(instance) (
          rate(node_cpu_seconds_total{mode="idle"}[1m])
        )) * 100 > 50
      for: 2m
      labels:
        severity: warning
      annotations:
        summary: High CPU usage detected on {{ $labels.instance }}
        description: |
          CPU usage has exceeded 50%
          Current value: {{ $value }}%
          Instance: {{ $labels.instance }}

    - alert: HighCPUUsageCritical
      expr: |
        (1 - avg by(instance) (
          rate(node_cpu_seconds_total{mode="idle"}[1m])
        )) * 100 > 80
      for: 2m
      labels:
        severity: critical
      annotations:
        summary: Critical CPU usage detected on {{ $labels.instance }}
        description: |
          CPU usage has exceeded 80%
          Current value: {{ $value }}%
          Instance: {{ $labels.instance }}


