Monitoring Redis Streams lag in Prometheus and Grafana
Monitoring Redis Streams lag in Prometheus and Grafana
In this post, we will look at how we can measure redis streams lag from the application perspective.
We would want to measure the lag and plot this in visual format using Prometheus in Grafana
Assumptions
-
We are going to assume that we have set of streams and set of consumer groups which are consuming from the stream. We are using consumer groups because we want high availability to consume via multiple nodes. We assume that each consumer within consumer groups are dynamic, for example if a consumer is running on a kubernetes node, a node can be restarted, respawned.
-
We are also going to assume that we are trimming stream length to some constant number of messages at regular intervals to save memory. This is important in terms of monitoring since redis reports some metrics assuming that consumer group has been consuming from beginning of stream, which many a times is not the case.
-
We are also going to assume that there is some constant minimum rate of message publish on redis stream. Why do we need this assumption? Not enforcing this restriction makes the monitoring even more difficult. We will see why below.
-
In the examples below, we have streams named
ack0, ack1, ack2, ack3, ack4consumed by consumer grouppoker-coordinator-ack
How do we define lag?
In terms of Redis streams, we are primarily interested in two metrics:
-
Undelivered messages: The messages which have been published on redis stream, but not yet have been consumed by the consumer group. This can happen if consumer group is taking a lot of time to process messages. This indicates that either we need to scale horizontally to increase the consumption rate or reduce the publish rate.
-
Pending messages: The message which have been consumed by the consumer group but yet not acknowledged. This is only applicable for redis streams consumer groups which have acknowledgement enabled. The messages which are not acknowledged, remain in Pending Entries List data structure. It is important to know the length of this data structure to determine if there were some messages in stream which were not acknowledged by the consumer.
We will now examine each of the redis stream related command output below to determine if it can help in monitoring redis streams.
xinfo groups ack0, will give information about ack0 stream consumer groups.
127.0.0.1:6381> xinfo groups ack3
1)  1) "name"
    2) "consumerGroup"
    3) "consumers"
    4) (integer) 2
    5) "pending"
    6) (integer) 0
    7) "last-delivered-id"
    8) "0-0"
    9) "entries-read"
   10) (nil)
   11) "lag"
   12) (integer) 8766
2)  1) "name"
    2) "poker-coordinator-ack"
    3) "consumers"
    4) (integer) 20
    5) "pending"
    6) (integer) 100
    7) "last-delivered-id"
    8) "1720934812760-0"
    9) "entries-read"
   10) (integer) 791553
   11) "lag"
   12) (integer) 11445
This output gives the number of consumer groups for stream ack3. Here, stream ack3 has two consumer groups namely consumerGroup and poker-coordinator-ack.
-
The number of consumers in both groups are 2 and 20 respectively.
-
The pending messages in both groups are 0 and 100 respectively.
-
The last delivered id for both groups is
0-0and1720934812760-0respectively. The first one indicates that its dead and is not running. This metric is useful in monitoring since it can tell us which was the last id which was delivered to this consumer group by redis stream. -
The entries read for both groups are
niland791553respectively. This number is lifetime aggregate and is usually useless for monitoring purposes. This is because stream length can generally be trimmed at regular intervals for saving memory as I mentioned in the assumptions. Once the stream length is trimmed, this number in comparison to stream length is very large. -
The lag for both groups is 8766 and 11445 respectively. The lag is important metric, however its important to understand it.
The lag of a given consumer group is the number of entries in the range between the group’s entries_read and the stream’s entries_added. Put differently, it is the number of entries that are yet to be delivered to the group’s consumers.
It seems that this number is a good metric to monitor for monitoring. However, there is a caveat to it. The way redis calculates this number is by subtracting the total number of messages published on stream minus the number of messages read by consumer group since beginning. In real world, the consumer group might have been created later after the stream is created OR there might have been some messages which were trimmed or deleted from the stream which this consumer group might never receieve. In that case, this number will always report very large value which is not what we want.
xpending ack3 poker-coordinator-ack will give the information about pending messages to the consumer group
127.0.0.1:6379> xpending ack3 poker-coordinator-ack
-> Redirected to slot [15549] located at 127.0.0.1:6381
1) (integer) 100
2) "1720937728800-4"
3) "1720937738803-1"
4) 1) 1) "F8DD1276E0DF496C965EC775CA07397F"
      2) "100"
This outputs that there are 100 pending messages. The smallest message id is 1720937728800-4 and largest message id is 1720937738803-1. The consumer (within the group poker-coordinator-ack) which has pending messages 100 with id F8DD1276E0DF496C965EC775CA07397F
xinfo consumers ack3 poker-coordinator-ack
 1) 1) "name"
    2) "07A1A45C9BCD40238A54F773ECB47B82"
    3) "pending"
    4) (integer) 0
    5) "idle"
    6) (integer) 1463079
    7) "inactive"
    8) (integer) 1463079
 2) 1) "name"
    2) "225EF592894744ADB4F0768797F608CE"
    3) "pending"
    4) (integer) 0
    5) "idle"
    6) (integer) 10170676
    7) "inactive"
    8) (integer) 10170676
The output above gives information about each unique consumer within a consumer group. Since our consumers are dynamic in a containerized infrastructure, the consumer group name is just a UUID. Once the container goes away, the unique consumer name is no longer relevant and we are not interested in the information. It is apparent that we are not interested in each consumer within a group. We want to make sure that a consumer group as a whole is healthy and consuming messages at healthy rate.
Calculating undelivered messages
The best way to calculate undelivered message is get the last delivered ID of the consumer group and the last delivered ID of the stream. Count the number of messages between them and report it as lag. Here is the pseudo code using Redisson client in java.
import org.redisson.api.StreamMessageId;
import org.redisson.api.stream.StreamReadGroupArgs;

public static void updateStreamLagMetrics(RedissonClient redisson, String streamName, String groupName) {
    RStream<String, String> stream = redisson.getStream(streamName);

    // Get stream info
    Map<String, Object> streamInfo = stream.getInfo();
    String lastGeneratedId = (String) streamInfo.get("lastGeneratedId");

    // Get group info
    Map<String, Object> groupInfo = stream.listGroups().stream()
            .filter(group -> group.get("name").equals(groupName))
            .findFirst()
            .orElseThrow(() -> new RuntimeException("Group not found"));

    String lastDeliveredId = (String) groupInfo.get("lastDeliveredId");

    // Get pending messages count
    PendingResult pendingInfo = stream.getPendingInfo(groupName);
    long pendingCount = pendingInfo.getTotal();

    // Calculate undelivered messages
    long undeliveredMessages = 0;
    if (!lastGeneratedId.equals(lastDeliveredId)) {
        StreamMessageId lastDeliveredStreamId = parseStreamMessageId(lastDeliveredId);

        // Read all messages after the last delivered ID
        List<StreamEntry<String, String>> undeliveredEntries = stream.readGroup(groupName, "temp-consumer",
            StreamReadGroupArgs.neverDelivered().count(Integer.MAX_VALUE));

        undeliveredMessages = undeliveredEntries.size();

        // Remove the temporary consumer
        stream.removeConsumer(groupName, "temp-consumer");
    }

    long totalLag = undeliveredMessages + pendingCount;

    // Update Prometheus metrics
    UNDELIVERED_MESSAGES.labels(streamName, groupName).set(undeliveredMessages);
    PENDING_MESSAGES.labels(streamName, groupName).set(pendingCount);
    TOTAL_LAG.labels(streamName, groupName).set(totalLag);
}

private static StreamMessageId parseStreamMessageId(String id) {
    String[] parts = id.split("-");
    if (parts.length != 2) {
        throw new IllegalArgumentException("Invalid stream ID format: " + id);
    }
    return new StreamMessageId(Long.parseLong(parts[0]), Long.parseLong(parts[1]));
}
However, note that counting the number of messages between two IDs is a very expensive operation which I do not recommend doing on a production cluster. Instead, what we can do is get the approximation of time difference between the two and report it as a metric. This is where the assumption that there is some constant minimum rate of message publish on redis stream. comes into picture. If the messages are sparingly published, this approach does not work.
Here is the updated code based on the assumption
    public  void computeStreamLag(RedissonClient redisson, String streamName, String groupName) {
        RStream<String, String> stream = redisson.getStream(streamName);

        // Get stream info
        StreamInfo<String, String> streamInfo = stream.getInfo();

        StreamMessageId lastGeneratedId = streamInfo.getLastGeneratedId();

        // Get group info
        List<StreamGroup> groupsInfo = stream.listGroups();
        StreamGroup groupInfo = groupsInfo.stream()
                .filter(group -> group.getName().equals(groupName))
                .findFirst()
                .orElseThrow(() -> new RuntimeException("Group not found"));

        StreamMessageId lastDeliveredId = groupInfo.getLastDeliveredId();
        // Get pending messages count
        PendingResult pendingInfo = stream.getPendingInfo(groupName);
        long pendingCount = pendingInfo.getTotal();

        // Calculate lag
        // Calculate undelivered messages
        long undeliveredMessages = 0;
        if (!lastGeneratedId.equals(lastDeliveredId)) {
            // If last generated ID is different from last delivered ID, there are undelivered messages
            undeliveredMessages = calculateIdDifference(lastGeneratedId, lastDeliveredId);
        }

        if (undeliveredMessages < 0) {
            undeliveredMessages = 0;
        }

         List<Tag> undeliveredMessagesTag =
                new ArrayList<>(Collections.singleton(Tag.of("type", "undeliveredMessages")));
        List<Tag> pendingMessages =
                new ArrayList<>(Collections.singleton(Tag.of("type", "pendingMessages")));

        this.prometheusMetricWrapper.recordGaugeValue(streamName, undeliveredMessagesTag, undeliveredMessages);
        this.prometheusMetricWrapper.recordGaugeValue(streamName, pendingMessages, pendingCount);
    }

    private static long calculateIdDifference(StreamMessageId id1, StreamMessageId id2) {
        long timeDiff = id1.getId0() - id2.getId0();
        long seqDiff = id1.getId1() - id2.getId1();

        if (timeDiff == 0) {
            return seqDiff;
        } else {
            // This is an approximation. Actual difference might be slightly different
            return (timeDiff) + seqDiff;
        }
    }

    private static StreamMessageId parseStreamMessageId(String id) {
        String[] parts = id.split("-");
        if (parts.length != 2) {
            throw new IllegalArgumentException("Invalid stream ID format: " + id);
        }
        return new StreamMessageId(Long.parseLong(parts[0]), Long.parseLong(parts[1]));
    }
What about measuring reliable processing Lag
We saw above that it is not possible to measure the redis streams lag (measured as count of mesasges) accurately if the rate of publish on the stream varies a lot.
How did we end up solving this?
One of the other ways of solving is to let publisher add the timestamp to the each of stream message. This way, when the message arrives at the consumer, you can calculate the difference and plot it as processing lag.
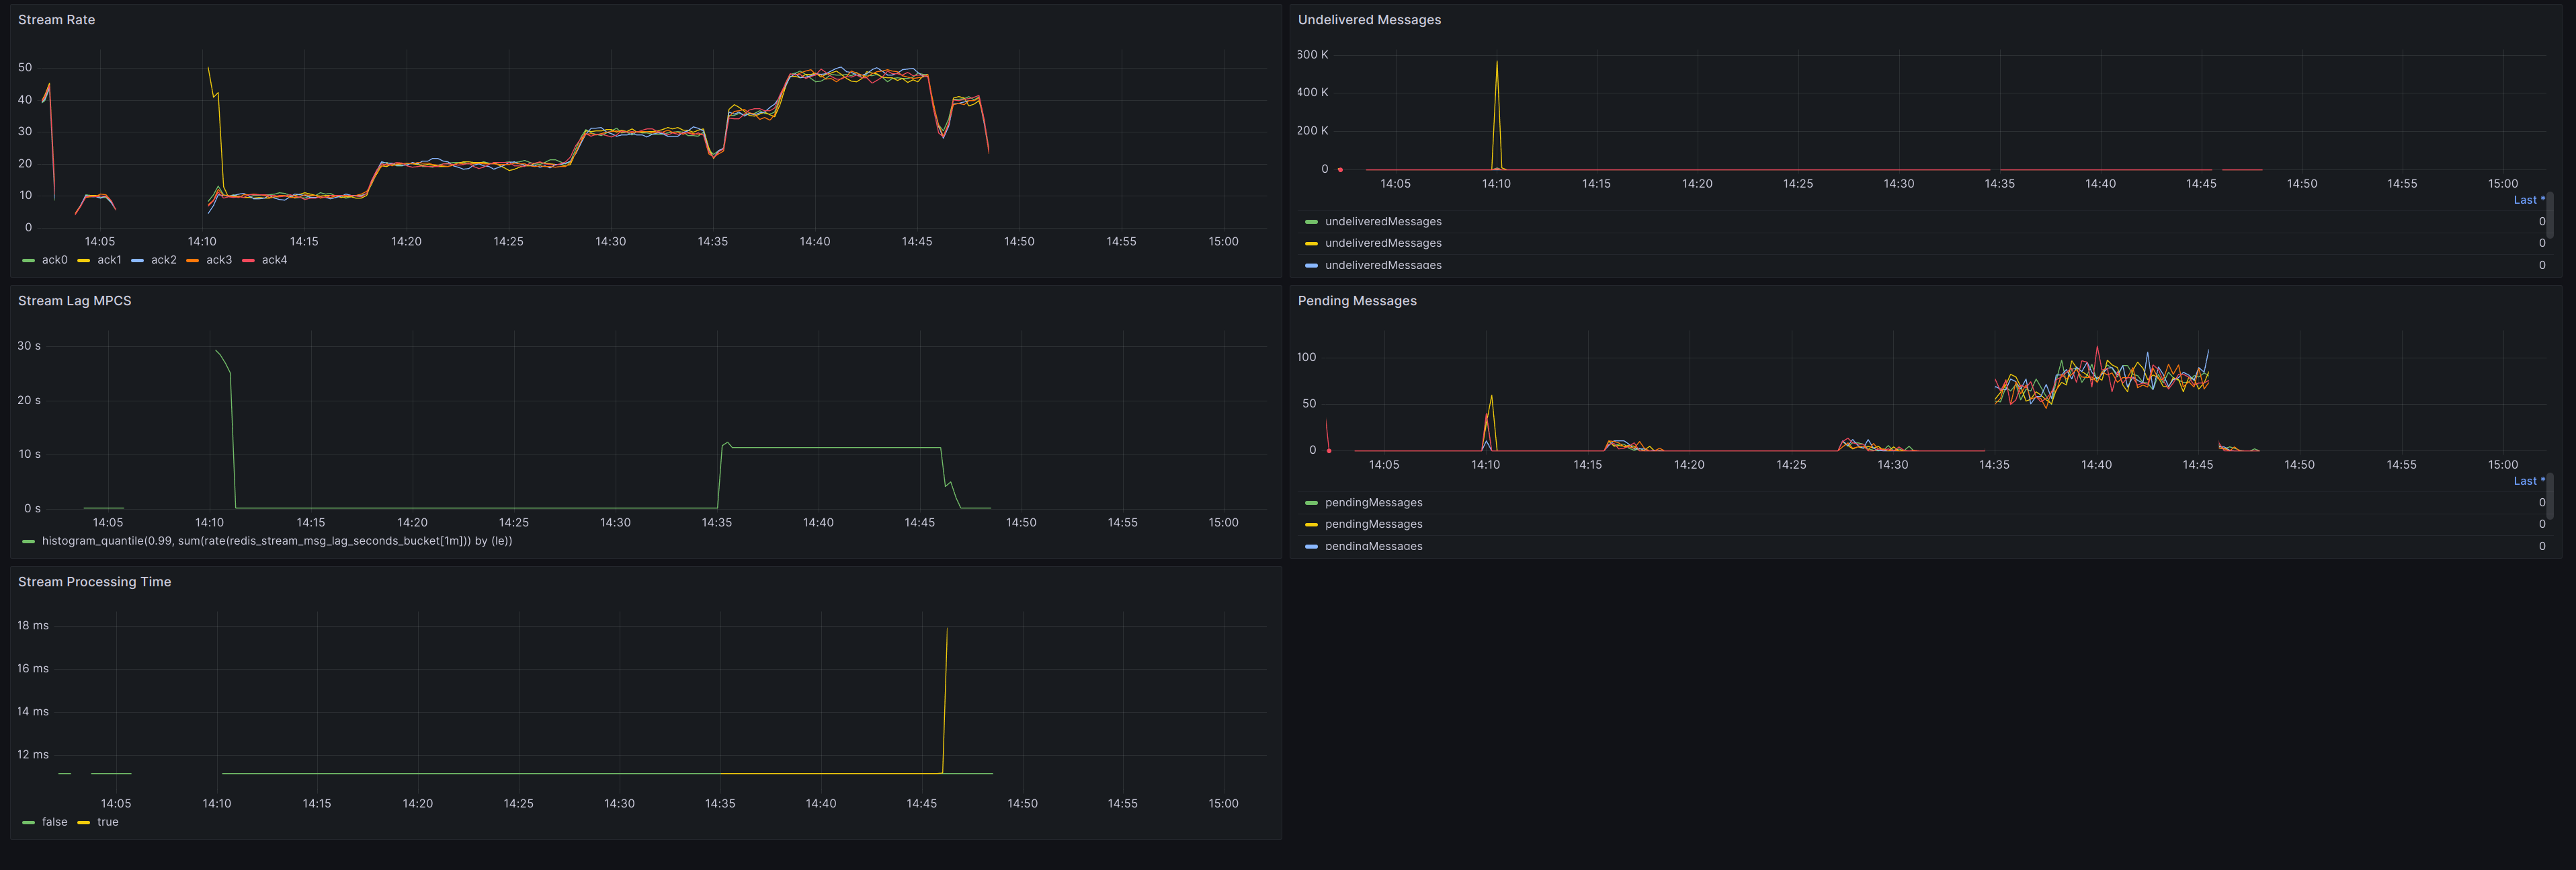
Conclusion
In this article we saw how to monitor redis streams lag. Here is the final snapshot of the dashboard which came out as a result of this excercise.